Building "Worlds Apart": Hand-Crafting an Interactive Multi-Lingual IPCC Infographic
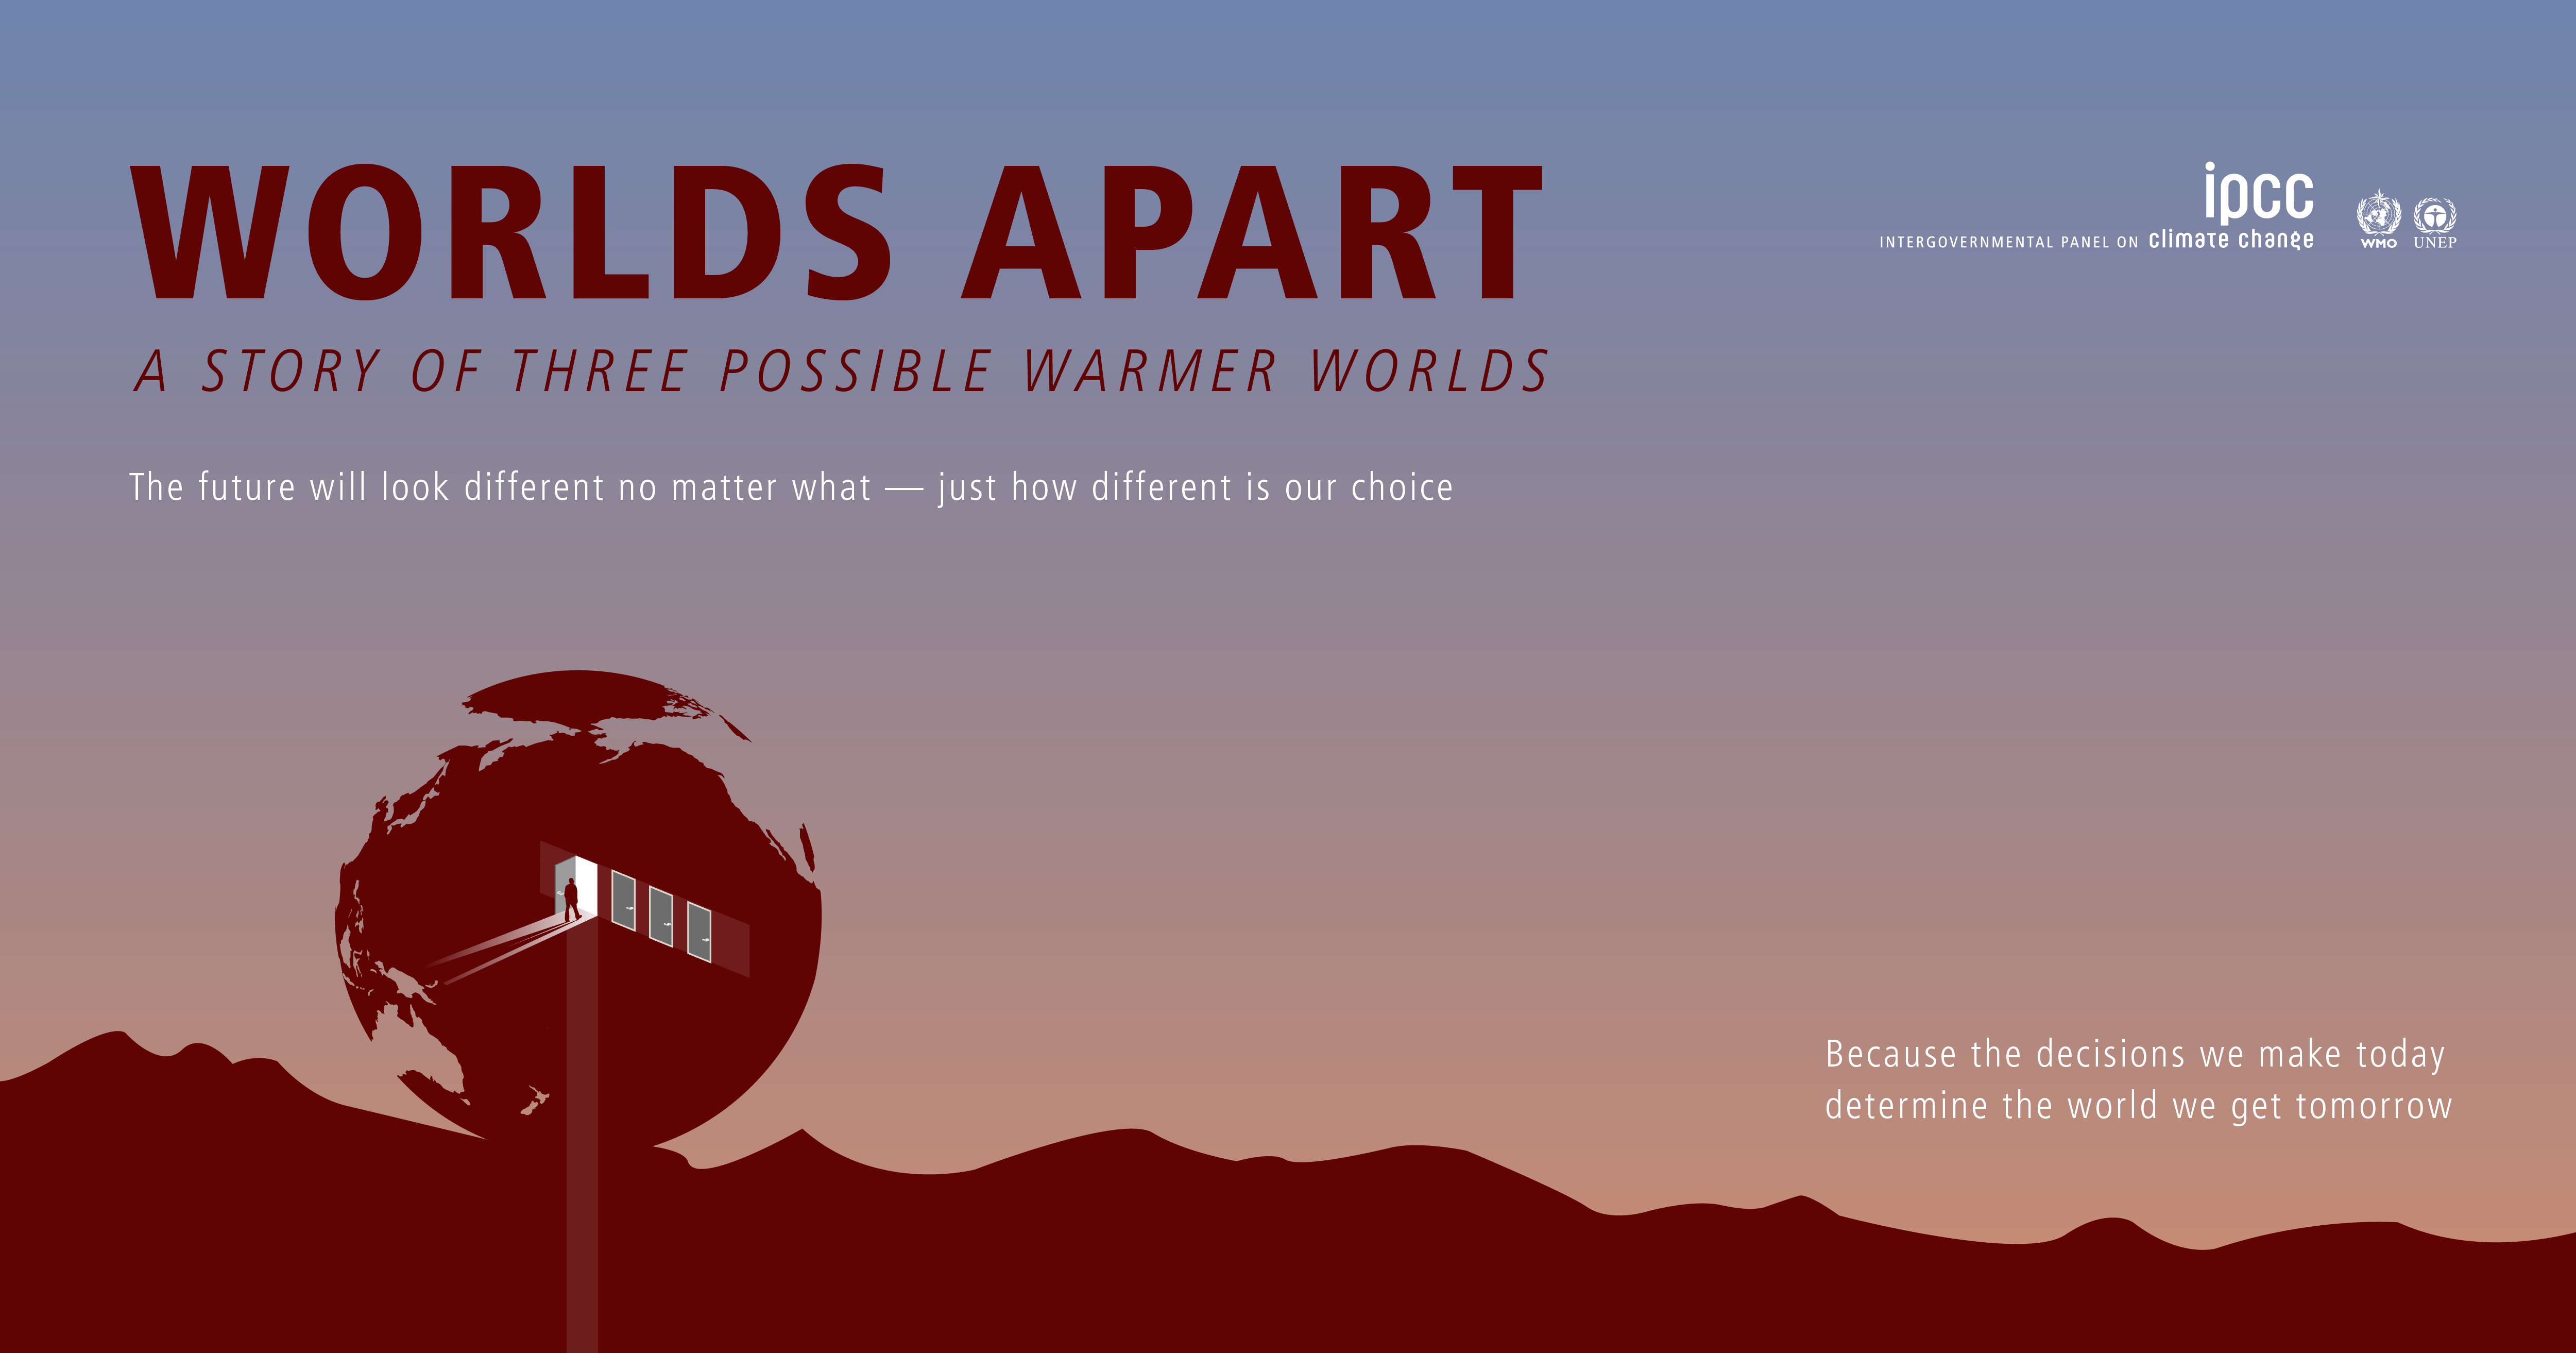
When translating complex climate science into public knowledge, static charts and dense technical reports can sometimes obscure the core message. Looking back at projects from a while ago—originally published around 2020 or 2021 during my time as IT Officer for Working Group I of the Intergovernmental Panel on Climate Change (IPCC)—one of the rewarding frontend builds was hand-crafting the interactive infographic page: Worlds Apart.
Based on the exceptional visual designs created by John Lang, this project aimed to present global climate warming scenarios—highlighting the stark differences in impacts between 1.5°C, 2°C, and higher global temperature rises—in a visual format accessible to researchers, policymakers, and the public alike.
John developed these designs working in direct collaboration with IPCC Lead Authors Sonia I. Seneviratne (Coordinating Lead Author focused on climate extremes and land-climate dynamics) and Joeri Rogelj (Coordinating Lead Author specializing in emission pathways and carbon budgets). This close partnership ensured that complex scientific assessments—spanning extreme heat events, drought risks, and carbon mitigation pathways—were distilled into intuitive visual narratives without sacrificing an ounce of scientific rigor.
Hand-Crafted Frontend Architecture
Rather than relying on heavy JavaScript framework stacks or monolithic CMS templates, the Worlds Apart infographic was built by hand using clean HTML5, custom CSS (css/style.css), and targeted frontend scripts.
Hand-crafting the code gave us complete control over every pixel, layout constraint, and interaction:
- Custom Layout Engine & Typography: Combined Bootstrap 4 structural grid components with custom viewport-scaling CSS (
full-width-imagetechniques) and tailored Google Fonts (Oswald for high-contrast, impactful headings and Montserrat for clean body legibility). - Interactive Navigation & Drawers: Hand-coded vanilla JavaScript for dynamic modal triggers and off-canvas navigation panels (
#my_offcanvas1), combined with jQuery for smooth animated offset scrolling (compensating for the fixed IPCC navigation header). - Global Performance & SEO Tags: Authored lightweight markup with complete Open Graph and Twitter Card metadata, ensuring near-instant load times globally—even for users accessing IPCC reports on low-bandwidth mobile networks.
The UN Multi-Lingual Challenge (i18n)
A key requirement for IPCC public communication is global equity in information access. The infographic could not exist in English alone—it needed to support all six official United Nations languages:
- English
- French (Français)
- Spanish (Español)
- Russian (Русский)
- Chinese (中文)
- Arabic (العربية)
Building an interactive visual layout to seamlessly host six drastically different linguistic structures presented unique engineering challenges:
1. Layout Flexibility & Text Expansion
Different languages vary dramatically in character length. A concise English heading might expand by 30% to 40% when translated into French or Spanish, while Chinese achieves the same meaning in far fewer characters. The CSS grid and flexbox layouts had to be constructed dynamically to handle variable line wrapping without breaking alignment or overlapping visual elements designed by John.
2. Right-to-Left (RTL) Support for Arabic
Arabic requires a complete reversal of layout flow. Beyond simply setting dir="rtl", we implemented logical CSS properties (such as margin-inline-start and padding-inline-end) and custom icon mirroring to ensure that visual arrows, comparative bars, and navigation flows naturally reversed direction for Arabic readers.
3. Typography & Character Set Rendering
Each language required carefully tuned font stacks and typography rules. From ensuring crisp rendering of Cyrillic letterforms to handling CJK font weights and Arabic diacritics, typography was calibrated to preserve legibility and aesthetic harmony across every version.
Bridging Science and Design
Working alongside designers like John Lang to transform technical IPCC assessment data into an intuitive, interactive web experience underscores the importance of thoughtful web development in scientific communication.
By building the Worlds Apart infographic by hand and engineering robust multi-lingual support, we helped ensure that critical climate impact data could be clearly understood by diverse audiences around the world.
You can explore the interactive infographic directly on the IPCC portal:
👉 ipcc.ch/report/infographic/worlds-apart/