Building Ember: An Interactive NASA Wildfire Sonification & Data Dashboard
At Kennebec, we believe that data shouldn’t just be seen—it should be felt. In our latest collaboration with electronic and ambient artist Karhide, we wanted to address a pressing environmental challenge: global wildfires.
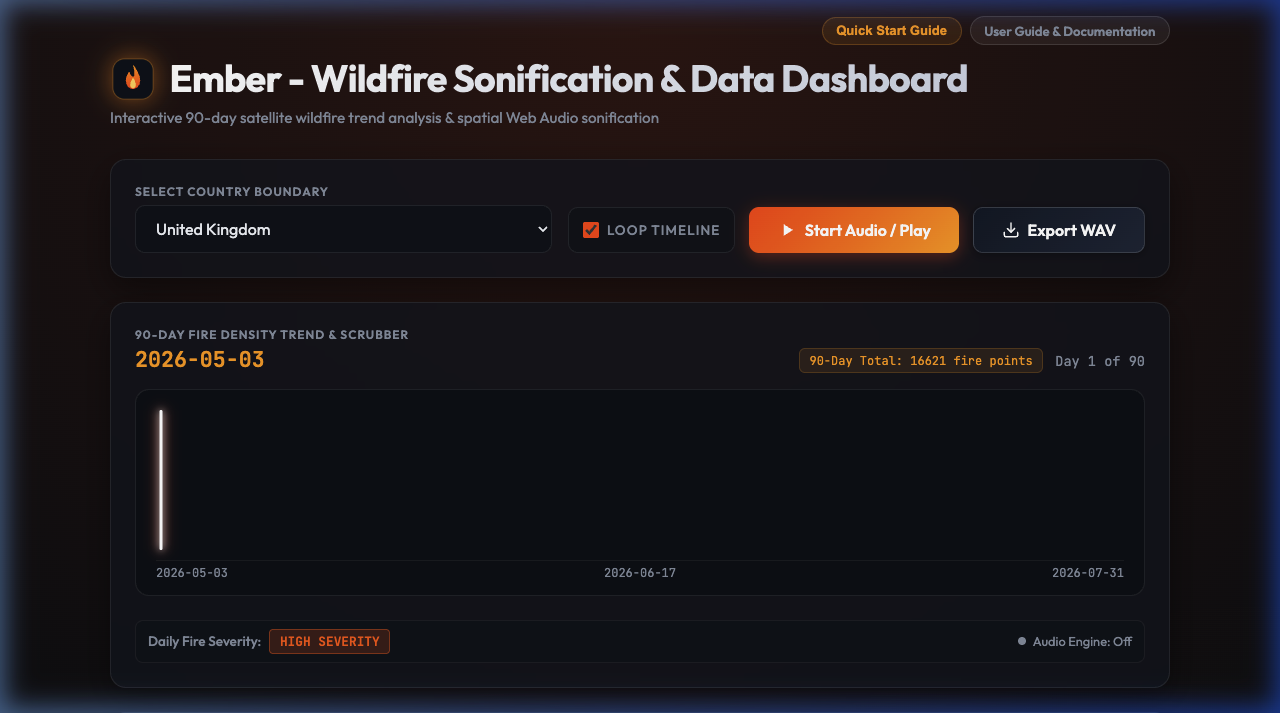
The result is Ember, an interactive web dashboard and 90-day satellite wildfire trend visualizer. By converting near-real-time wildfire tracking data into spatial Web Audio sonifications, Ember offers a multi-sensory way to explore environmental trends across 19 countries.
Here is the technical story behind how we built the automated daily pipeline, processed spatial geographic coordinates, and synthesized data into sound entirely in the browser.
The Architecture: High-Performance and Serverless
To ensure Ember load times remain fast and highly resilient under heavy traffic, we designed a serverless, static architecture using Astro.
Instead of querying a backend database or external APIs in real time when a user visits the page (which introduces API key security risks and rate-limiting bottleneck delays), Ember uses a pre-built static data model (data.json). The database is updated automatically in the background, and the frontend is rebuilt statically every day.
Here is how the automated daily data pipeline works:
graph TD
    A[NASA FIRMS API] -->|Daily Cron: 06:00 UTC| B[GitHub Actions Runner]
    B -->|process_fires.py| C[GeoPandas Spatial Filter]
    C -->|Generate static data| D[public/data.json]
    D -->|Commit & Push| E[GitHub Repository]
    E -->|Auto Build Trigger| F[Cloudflare Pages]
    F -->|Serve Static Site| G[User Browser]
1. Pulling NASA Satellite Data
Every morning at 06:00 UTC, a GitHub Action cron job triggers our data processing workflow. The workflow boots a temporary runner and runs a custom Python script (process_fires.py).
The script queries the NASA FIRMS (Fire Information for Resource Management System) API, pulling the last 90 days of Near-Real-Time (NRT) hotspot data recorded by the VIIRS (Visible Infrared Imaging Radiometer Suite) satellite sensors.
2. Spatial Mapping with GeoPandas and Shapely
The raw NASA FIRMS payload contains thousands of latitude and longitude coordinates. To make this data interactive, we need to associate each fire hotspot with its corresponding country.
The script iterates through a folder of high-resolution country boundaries (saved as GeoJSON files) and uses GeoPandas and Shapely to perform a spatial join (point-in-polygon intersection):
- It reads the country borders and transforms the coordinate reference system to standard WGS84 (
EPSG:4326). - It maps each satellite coordinate to a 2D spatial
Pointand filters for points that sit strictly inside the country border polygons. - It aggregates daily statistics, including the active hotspot count and the maximum Fire Radiative Power (FRP) measured in Megawatts (MW).
3. Panning & Scaling Coordinates
To translate geography into stereo sound, the script calculates the relative position of each hotspot within the country’s bounding box:
- Stereo Pan: Maps the longitude of the hotspot non-linearly to a stereo pan value between
-1.0(hard left) and+1.0(hard right). - Normalized FRP: Scales the Fire Radiative Power value relative to the global maximum observed in that country during the 90-day window.
4. Automatic Build and Deployment
The final output is aggregated and written to public/data.json. The GitHub Action automatically commits this updated file back to our repository.
Since Ember is hosted on Cloudflare Pages, this repository commit triggers an instant Cloudflare webhook. Within 30 seconds, Cloudflare builds the Astro site and distributes the new static pages and data.json globally, keeping the data updated with zero server overhead.
Translating Fire into Sound: The Sonification Engine
Once the user selects a country and starts the audio engine, the static JSON timeline is read by the frontend, which synthesizes audio in real time using the Web Audio API (via the Tone.js framework).
To capture the emotional weight of wildfire escalation, we mapped daily metrics to five distinct sound layers:
- Lead Synth (Hotspot Indicators): Cycles through the top 20 most intense active hotspots of the current day. The pitch rises as the hotspot’s Fire Radiative Power increases, and the stereo placement reflects its real geographic longitude.
- Thermal Pad (Harmonic Density): A detuned pad playing warm, tension-filled chords. The volume and detune amount swell dynamically based on the total daily fire count, indicating global severity.
- Earth Bass (Rumble): A deep sub-bass oscillator that growls when fire activity escalates, grounding the sonification in a heavy, physical rumble.
- Flame Wind (Atmospheric Sweep): A white noise generator routed through a resonant high-Q bandpass filter. The cutoff frequency sweeps up and down, mimicking the crackle and roar of dry winds whipping through a forest fire.
- Ember Sparks (Micro-transients): High-frequency granular transients that click and pop. A random trigger engine generates more frequent, widely-spaced clicks as fire density rises, replicating the sound of embers floating in the air.
To prevent digital clipping and protect user hearing during extreme fire surges, the master output flows through a custom Brickwall Peak Limiter (a standard DynamicsCompressorNode set to a 20:1 ratio at -1.5 dBFS with a fast 3ms attack).
Interactive UI and Visualization
To accompany the audio, we built a custom dashboard using vanilla CSS and glassmorphic styling:
- 90-Day Sparkline Scrubber: A custom-rendered SVG histogram tracking daily fire density. Users can click and drag a playhead scrubber across the timeline to listen to specific dates.
- Metric Cards: Real-time counters showing the daily hotspot count, peak Fire Radiative Power (MW), and normalized density ratio.
- Oscilloscope Waveform Monitor: A canvas-based visualizer rendering the combined output of the Web Audio context in real time.
- Data Exporters: Features to render and download the 90-day sonification directly into a high-definition
.wavfile, or export the aggregated timeline metrics to a.csvdocument.
Experience the Project
By combining modern geopatial libraries in Python with high-performance audio synthesis in the browser, Ember demonstrates how complex environmental datasets can be made accessible and emotionally resonant.
🔗 Explore the Dashboard: ember.kennebec.co.uk
🛠️ Collaboration: Developed by Kennebec with audio and instrument concepts by Karhide.
Interested in building a custom web application, data visualizer, or interactive Web Audio tool? Get in touch with the team at Kennebec.