Building Sonimet: Translating OpenAlex Academic Data into Interactive Web Soundscapes
As web developers, we are constantly looking for new ways to visualize complex datasets. We build charts, tables, maps, and dashboards. But what if we could hear the data instead? What if the decades-long academic career of a world-shaping scientist could be translated into a fluid, generative musical composition?
This was the question that brought sociologist Lutz Bornmann (Max Planck Society), electronic composer Karhide, and myself together to build Sonimet (https://sonimet.kennebec.co.uk/).
Sonimet is an open-source, browser-based data sonification tool designed to query academic record databases and translate a researcher’s entire publication history and citation impact into interactive sound and visuals. Here is a look behind the scenes of how we built it, from API queries to the Web Audio API.
The Vision: A Collaboration of Science, Web Dev, and Audio
The project began as an intersection of three distinct disciplines:
- Lutz Bornmann provided the bibliometric methodology, determining how to group and analyze publication records to fairly represent a scientist’s research footprint.
- Karhide designed the audio parameters, establishing how numerical values should map to musical keys, modes, and instrument timbres to make the output aesthetically pleasing.
- My role (Kennebec) was to build the web engine—crafting the interface, querying the databases in real time, drawing the visual swarms, and generating the browser-based synthesizer.
Sourcing the Data: Harnessing the OpenAlex API
To make Sonimet fully interactive, we needed a robust, open academic registry that could handle queries for thousands of researchers on the fly. We chose the OpenAlex API—a massive, open catalog of scholarly papers, authors, and institutions.
When a user types a researcher’s name into the Sonimet search bar, the app executes a sequence of API requests:
- Author Search: Locates the author’s unique OpenAlex ID (along with their affiliation and ORCID if available).
- Works Retrieval: Fetches the complete list of publications associated with that author ID, including publication year, citation counts per year, co-author list, and open access status.
Because OpenAlex serves data in clean JSON structures, we can parse a scholar’s career in seconds. For active scientists with hundreds of papers and tens of thousands of citations, we consolidate this timeline chronologically, preparing it for the visualization and audio pipelines.
Visualizing the Research: The “Organic Swarm”
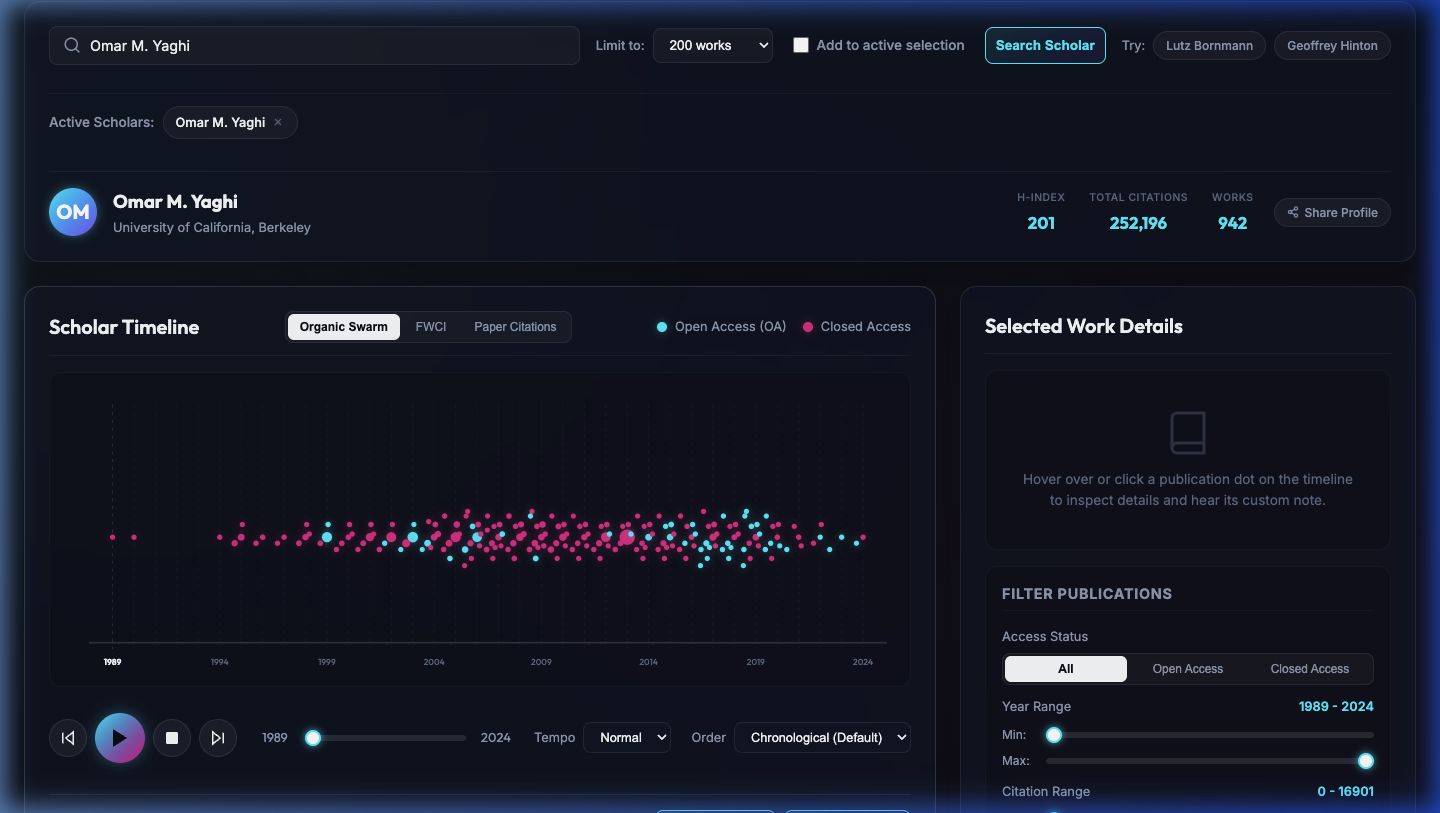
We wanted to represent publications as more than a standard line chart. We designed the Organic Swarm—a customized SVG-based timeline visualization where papers are plotted as circular nodes.
- The X-Axis (Timeline): Represents the progression of the researcher’s career, running from left to right.
- The Y-Axis (Impact): Represents the relative citation density of the papers. High-impact papers soar to the top of the canvas, creating peaks that represent breakthrough discoveries.
- Color as Access: We color-code nodes based on their publishing model. Cyan nodes represent Open Access publications (free to read, share, and build upon), while Magenta nodes represent Closed Access papers. This visual distinction creates an immediate, striking picture of a researcher’s open-science footprint.
Here is what the interface looks like when rendering the career of chemist Omar M. Yaghi:
Sonification: Generating Notes in the Browser
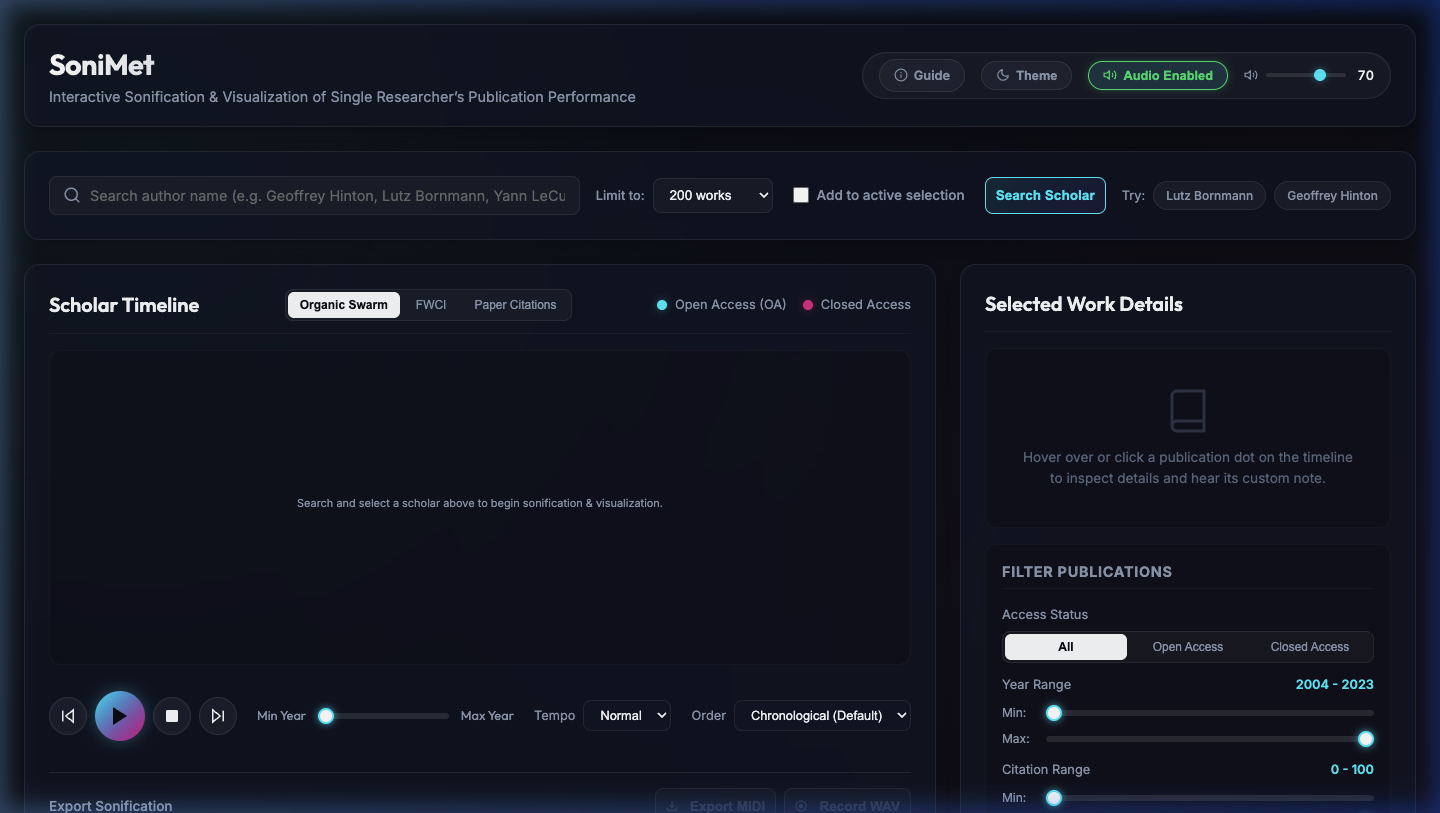
To translate this visual swarm into music, we built a browser-based synthesizer using the native Web Audio API and MIDI mapping parameters.
Instead of playing random tones, the engine maps academic metrics to precise musical values:
- Publication Milestones (Trigger): Each paper node triggers a musical event. The chronological position dictates when the note plays.
- Citation Count (Pitch & Velocity): The number of citations a paper has accumulated determines its MIDI velocity (loudness) and pitch offset. Highly cited papers trigger high-velocity, high-frequency notes that stand out as bright, resonant bell-like sweeps.
- Co-authors (Rhythmic Division): The number of co-authors on a paper controls the rhythmic subdivision, adding complexity and syncopation to tracks where researchers collaborate heavily.
- Open Access (Timbre & Effects): Open Access papers route their audio through a brighter, resonant filter envelope with a long decay, while Closed Access papers trigger shorter, muted tones. This creates a musical dialogue between open and restricted science.
Users can adjust the playback speed (BPM), select different scale modes (Major, Dorian, Aeolian, Lydian), and toggle instrument voices directly in the dashboard UI.
From Browser Sketches to a Studio Album
While the browser engine was designed to let users explore and play research data, we wanted to see how far these compositions could be pushed artistically.
Using Sonimet’s MIDI export functionality, Karhide downloaded the raw data-driven MIDI files for 14 world-shaping researchers—including the 2025 Nobel Prize Laureates in Physics, Chemistry, Medicine, and Economics.
He imported these raw tracks into Ableton Live, mapping the notes to premium hardware-modeled synthesizers to create a professional ambient electronic LP, “The Sound of Nobel Laureate Research”, which is out now.
It’s been incredibly rewarding to see Sonimet move from a simple data-querying script to an interactive web app, and finally to a source of inspiration for a studio music album. We hope the tool inspires developers, researchers, and artists alike to rethink how we interact with scientific literature.
Get Involved & Explore
- Try Sonimet: Look up your own publication history or search for your favorite scientist at https://sonimet.kennebec.co.uk/
- Listen to the Music: Stream or pre-order the companion album by Karhide on Bandcamp: https://karhide.bandcamp.com/album/the-sound-of-nobel-laureate-research
- Read the Documentation: Explore our detailed mapping guidelines directly in the Sonimet User Guide.
