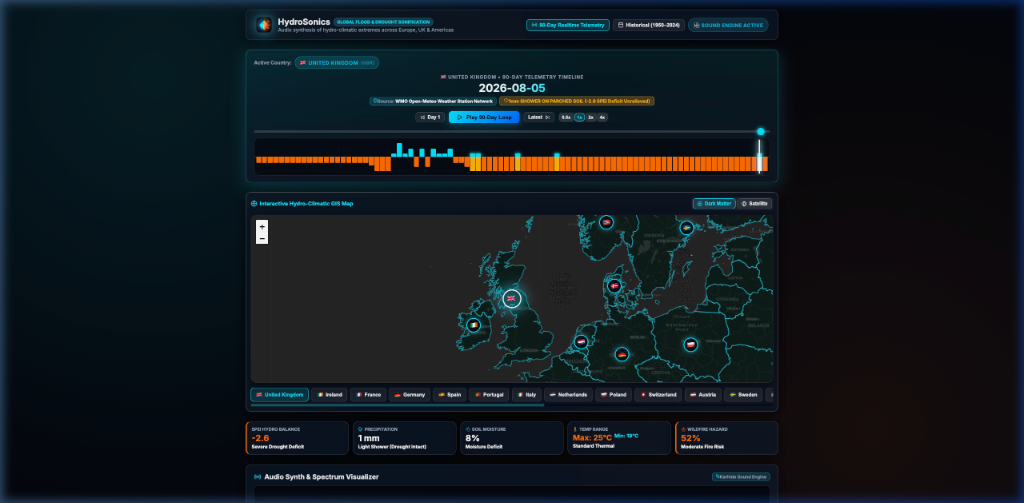
Building HydroSonics: Orchestrating a 90-Day Real-Time Satellite Telemetry Pipeline
In developing HydroSonics, the goal was to build a highly responsive, zero-maintenance web application that displays rolling, real-time climate indicators without requiring a persistent database or dedicated backend server.
The result is HydroSonics, a global flood and drought sonification platform that synthesizes hydro-climatic extremes across Europe, the UK, and the Americas.
The Architecture: Static but Live
HydroSonics runs entirely on Vite + React 18 and is hosted on Cloudflare Pages. To power the map with real-time data, we designed a serverless telemetry pipeline using GitHub Actions:
graph TD
    A[Copernicus ERA5 & Open-Meteo APIs] -->|Daily Cron: 00:00 UTC| B[GitHub Actions Runner]
    B -->|Calculate SPEI & Saturation| C[Telemetry Script]
    C -->|Generate flat-file JSON| D[src/data/realtime90Days.json]
    D -->|Git Auto-Commit| E[GitHub Repository]
    E -->|Instant Rebuild Hook| F[Cloudflare Pages]
F -->|Serve Lightweight Client| G[User Browser]- Automated Daily Extraction: Every night at 00:00 UTC, a custom cron workflow (
.github/workflows/update-realtime-data.yml) queries Copernicus ERA5 & Open-Meteo public satellite APIs. - Calculations on the Fly: The script calculates the Standardized Precipitation-Evapotranspiration Index (SPEI), topsoil moisture saturation levels, temperature margins, and Wildfire & Ember Hazard scores for the last 90 days.
- Flat-File JSON Storage: The processed metrics are written straight to
src/data/realtime90Days.json. - Git-Auto-Commit: The pipeline commits the updated JSON file back to the repository.
- Instant Rebuild: The new commit triggers an automatic static build on Cloudflare Pages, making updated live data available globally in under two minutes.
Scaling Down Historical Data
While the app prioritizes the immediate 90-day window, providing historical context was key. We packaged 75 years of regional climate history (1950–2024) into heavily optimized, indexed JSON structures.
Users can seamlessly compare today’s live satellite telemetry against historical baselines, charting regional climate shifts over decades. By pushing data computations upstream to the CI/CD pipeline, the client-side remains exceptionally lightweight, responsive, and secure.
Experience the Project
By combining serverless automation with high-performance audio synthesis in the browser, HydroSonics demonstrates how climate indicators can be brought to life interactively and sonically.
- 🔗 Explore the Dashboard: hydrosonics.kennebec.co.uk
- 🛠️ Collaboration: Developed by Kennebec with audio and instrument concepts by Karhide.
Interested in building a custom web application, data visualizer, or interactive Web Audio tool? Get in touch with the team at Kennebec.